Wireless Sensor Networks
Wireless Sensor Networks
Wireless sensor networks (WSNs) consist of many small (up to several hundred), low powered nodes capable of sensing various physical and environmental phenomenon. WSNs are capable of covering a large area by the spatial distribution of the networked nodes. The nodes sense, process and communicate data to the central base station for analysis. The distinguishing characteristic of WSN is its low power operation, rendering the network to function for longer durations (months to years) without the need of battery replacement. Depending on the target application, almost any type of sensor technology can be embedded on the WSN nodes, however, for wireless communication, the IEEE 802.15.4x standard is the suggested standard, to support low rate, low cost and low power operation of WSNs.
Most off the shelf wireless sensor nodes are capable of sensing vibration, light intensity, temperature, humidity etc. The aim is to embed air quality sensors on the nodes and network the devices for seamless, real time flow of data for indoor environment monitoring and analysis. The additional air quality transducers are expected to have an impact on the battery life of the sensor nodes, thus, careful decision on the sensor wake/sleep is required. Another important challenge is the identification of optimal sensor positioning. To overcome this, a number of tests will be carried out to place sensors at locations so that the probability of measuring highly correlated redundant data is reduced.
Apart from the real-time visualisation of sensor data, offline analysis of the data is paramount. The analysis should answer the following questions:
- Does the data represent the true nature of the sensed phenomena?
- Are there outliers in the data, how to identify and deal with them?
- Is the data reliable enough to develop predictive models?,
- How to deal with correlated data?
- Can the recalibration of sensors be warranted from the data (e.g., a sensor registering high number of outliers or producing unexpected measurements?)
- Can geostatistiscal methods be applied to interpolate at points where sensor measurements are not taken?
Positioning of Sensors
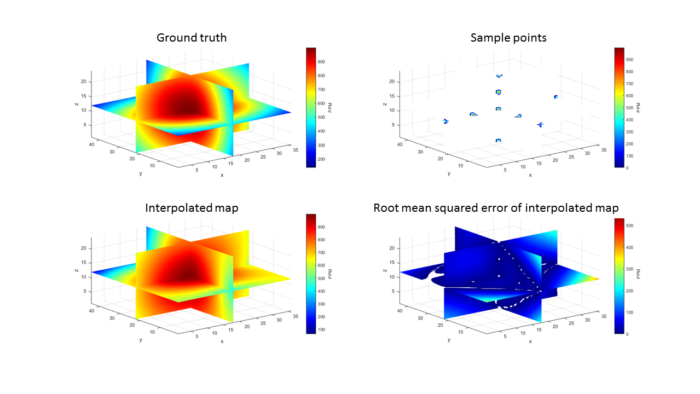
We intend to investigate where and how many sensors are required to get a picture of a room's IAQ. Top left shows a hypothetical concentration of CO2 as from a central source in a room with no ventilation. Top right shows where sensors were placed and what they measured. Bottom left shows an interpolated map of the data that the sample points recorded. Bottom right shows the error of the interpolated map vs the true picture (top left).
Student Work
A top level MSc student created an IoT test rig to monitor environments, demonstrating accuracy in mobile and static locations. The results were published in an international conference proceedings.